Discussion Forum
Peer response DP
The post rightly points out the challenges encountered by companies in using data science (DS) and the difficulties in planning linked to recent events such as the pandemic or the Ukraine conflict. Whilst Saxena (2021) and Yildrim (2020) further raised concerns around the ongoing requirements for data scientists and the future challenges the role might incur, Dhar (2012) supported the view that DS foremost is "the study of the generalisable extraction of knowledge". Kitchin (2014) raised the concept further and defined DS as a paradigm shift from knowledge-driven decision-making toward a more precise data-driven process. For instance, this evolution can be observed in the recent development of antibiotics through machine learning and away from the typical medical development team (Guardian, 2020). Exscientia's new OCD medication derived through artificial intelligence is also an excellent example of this evolution (Wakefield, 2020). A recent study from Zewe (2022) further points out how machine learning models are used to propose new molecules for drugs, a process which until recently was done by knowledge holders. Albeit these examples are mainly from the pharmaceutical industry, several examples can be observed in other industries such as agriculture, manufacturing or even climate science (Lu et al., 2022; Chang et al., 2018; Jeble et al., 2018). Provost (2013) rightly points out that we must stop seeing data science through the lens of algorithms, techniques, and tools in everyday use but more as a novel approach to problem-solving. This novel approach will make the data scientist more valuable as the complexity of problems keeps increasing.
References
Chang, C.-L., McAleer, M. and Wong, W.-K. (2018) ‘Big Data, Computational Science, Economics, Finance, Marketing, Management, and Psychology: Connections.’ SSRN Electronic Journal.
Dhar, V. (2012) ‘Data Science and Prediction.’ SSRN Electronic Journal, 56(12).
Guardian (2020). Powerful antibiotic discovered using machine learning for first time. The Guardian. [online] 20 Feb. Available at:
https://www.theguardian.com/society/2020/feb/20/antibiotic-that-kills-drug-resistant-bacteria-discovered-through-ai [Accessed 28 Sep. 2022].
Jeble, S., Dubey, R., Childe, S. J., Papadopoulos, T., Roubaud, D. and Prakash, A. (2018) ‘Impact of big data and predictive analytics capability on supply chain sustainability.’ The International Journal of Logistics Management, 29(2) pp. 513–538.
Kitchin, R. (2014) ‘Big Data, new epistemologies and paradigm shifts.’ Big Data & Society, 1(1) p. 205395171452848.
Lu, L., Tian, G. and Hatzenbuehler, P. (2022) ‘How agricultural economists are using big data: a review.’ China Agricultural Economic Review, January.
Provost, F. and Fawcett, T. (2013). Data Science and its Relationship to Big Data and Data-Driven Decision Making. Big Data, [online] 1(1), pp.51–59. doi:10.1089/big.2013.1508.
Saxena, P. (2021) There Will Be a Shortage of Data Science Jobs in the Next 5 Years? Available from: https://towardsdatascience.com/there-will-be-a-shortage-of-data-science-jobs-in-the-next-5-years-9f783737ed23 [Accessed 28 September 2022].
Wakefield, J. (2020). AI-created drug to be used on humans for first time. BBC News. [online] 30 Jan. Available at: https://www.bbc.com/news/technology-51315462.
Yıldırım, S. (2020). The Dark Side of the Sexiest Job of the 21st Century. [online] Medium. Available at: https://towardsdatascience.com/the-dark-side-of-the-sexiest-job-of-the-21st-century-fd9c46bf4cae.
Zewe, A. (2022). A smarter way to develop new drugs. [online] MIT News | Massachusetts Institute of Technology. Available at: https://news.mit.edu/2022/ai-molecules-new-drugs-0426.
Peer response DP
The post raises serious questions about data science (DS) and ethics, which are of utmost importance. Boyd and Crawford (2012) challenge the concept of DS as the panacea to all problems, raising questions around ethics and the influence of nefast actors. The authors further raise questions about possible data access limitations from governmental institutions or large companies, which cannot be discounted and currently observed in more autocratic countries. In addition, questions to which purpose DS projects are developed and who will be asking the questions data scientists need to answer needs also further inquisition. Leonelli (2016) further posed the question of whether accountability and responsibility are located totally with the project sponsors or with the team working on the DS project, which could have various ramification for the profession.
Considering the immense growth of data to 97 zettabytes in 2021, with the prospect of doubling further by 2025 (Statista, 2021), it must be remembered that a significant part of this amassment is private human information, which if exploited negatively can have a nefarious effect on the people involved. Further inquiry must also be raised about companies using this data for revenue growth and influence, with only tech-savvy individuals able to limit this impact, leaving large swaths of the population exposed to ethical breaches with no possibility to limit the damage.
Notwithstanding, this vigorous debate has put ethics at the forefront of DS and where academia and governments can make a substantial impact by providing ethical guidelines and best-in-class processes to ultimately make DS a benefit for everybody.
References:
Boyd, D. and Crawford, K. (2012) ‘Critical Questions for Big Data.’ Information, Communication & Society, 15(5) pp. 662–679.
Leonelli, S. (2016). Locating ethics in data science: responsibility and accountability in global and distributed knowledge production systems. Philosophical Transactions of the Royal Society A: Mathematical, Physical and Engineering Sciences, 374(2083), 20160122.
Statista (2021) Shibboleth Authentication Request. https://www-statista-com. Statista. [Online] [Accessed on 28th September 2022] https://www-statista-com.mmu.idm.oclc.org/study/14634/big-data-statista-dossier/.
Peer Response:
The observations raised by the post rightly reflect the current evolution of the data scientist and the challenges raised to the role by Saxena (2021) and Yildrim (2020) around the level of skills required and the long-term availability of the role. In addition, recent studies (Gartner 2015a, VentureBeat, 2019) also show little return on investment for companies on big-data projects, which might pose further challenges to the role. In addition, Gartner dropped big data (BD) altogether from its hype-cycle as it did not make it through to a plateau of "Plateau of Productivity" as early as 2015 (Gartner, 2015b). Notwithstanding the negative outlook, remarkable successes can be attributed to the application of data science (DS) in several industries. Pfizer's DS team was pivotal in the development and the speedy delivery of the Covid vaccine across most of the developed world (Waltz, 2021). Marscia (2022) further stated the argument that DS will be pivotal in advancing a new era of medical discoveries. In addition, in the trading environment, DS has helped in automating 92% of forex and more than 80% of equity trading (Shadmehry, 2021). Kuslak (2017) further suggests that manufacturing can still gain significant benefits in terms of efficiency and effectiveness through the application of DS. Considering that the amount of data generated by 2021 was more than 97 zettabytes and forecasted to double by 2025 (Statista, 2021), the benefits still available through DS are still immense across industries such as healthcare, finance, marketing, and business, making the role of the data scientist ever more relevant.
References:
Gartner (2015a). Taking a First Step to Advanced Analytics. Gartner.
Gartner (2015b). Big Data Hypecycle. Gartner. Available at: https://www.gartner.com/en/products/special-reports [Accessed 28 Sep. 2022].
Kusiak, A. (2018) Smart manufacturing, International Journal of Production Research, 56:1-2, 508-517, DOI: 10.1080/00207543.2017.1351644
Marscia, K. (2022). How Data Science Is Ushering in a New Era of Modern Medicine. [online] Content Lab U.S. Available at: https://www.jnj.com/innovation/how-data-science-ushers-in-new-era-of-modern-medicine [Accessed 28 Sep. 2022].
Saxena, P. (2021) There Will Be a Shortage of Data Science Jobs in the Next 5 Years? Available from: https://towardsdatascience.com/there-will-be-a-shortage-of-data-science-jobs-in-the-next-5-years-9f783737ed23 [Accessed 28 September 2022].
Shadmehry, C. (2021). How Profitable is Algorithmic Trading in 2021? [online] Hands-Off Investing. Available at: https://medium.com/automated-trading/how-profitable-is-algorithmic-trading-in-2021-1b63489cd70a [Accessed 28 Sep. 2022].
Statista (2021) Shibboleth Authentication Request. https://www-statista-com. Statista. [Online] [Accessed on 11th September 2022] https://www-statista-com.mmu.idm.oclc.org/study/14634/big-data-statista-dossier/.
VentureBeat (2019). Why do 87% of data science projects never make it into production. https://venturebeat.com/2019/07/19/why-do-87-of-data- science-projects-never-make-it-into-production.
Waltz, E. (2021) Pfizer’s Edge in the COVID-19 Vaccine Race: Data Science. IEEE Spectrum. [Online] [Accessed on 11th November 2021] https://spectrum.ieee.org/pfizer-covid-vaccines-data-science.
Yıldırım, S. (2020). The Dark Side of the Sexiest Job of the 21st Century. [online] Medium. Available at: https://towardsdatascience.com/the-dark-side-of-the-sexiest-job-of-the-21st-century-fd9c46bf4cae.
Initial Post
The emergence of Big Data (BD) has been one of the most critical drivers of data science (DS). BD also provides a foundation for the digital and virtual economy, scientific discovery and social governance (Xu et al., 2021). Within these areas, immense possibilities for innovation are given, such as industrial and management innovation, scientific discovery and the creation of new disciplines. Notwithstanding, transforming BD into economic, social and cultural value poses the most critical challenges, culminating in the data scientist's establishment.
The first attempts to make sense of BD were approached by business intelligence specialists, with their role mainly focused on evaluating data to make sense of the past. In contrast, the data scientist uses data for its predictive value by using new theories, methodologies and advanced technologies (Dietrich, Heller and Yang, 2015). The increased value provided by DS has fueled a growing demand for experts in the field, with more than 900.000 job posting in 2018 in the UK alone (The Royal Society, 2019). Despite the tremendous future outlook, several authors advanced challenges around the role and its future outlook. In a 2019 study, VentureBeat revealed that 87% of data science projects do not become life. Gartner further stated that 80% of data science projects would not deliver business outcomes through most of the 2020s, a statement further confirmed by a NewVantage Partner survey that 77% of companies do not realize value through BD initiatives. In addition, Yildrim (2020) further poses the question of whether future automation might not hinder the growth of data scientists' roles in the future.
References:
Dietrich, D., Heller, B. and Yang, B. (2015). Data science & big data analytics : discovering, analyzing, visualizing and presenting data. Indianapolis, In: Wiley.
Gartner (2015). Taking a First Step to Advanced Analytics. Gartner.
NewVantage Partners (2019). Big Data and AI Executive Survey (2019). New Vantage Partners.
The Royal Society (2019). Dynamics of data science skills How can all sectors benefit from data science talent? [online] The royal Society. Available at: https://royalsociety.org/topics-policy/projects/dynamics-of-data-science/ [Accessed 25 Sep. 2022].
VentureBeat (2019). Why do 87% of data science projects never make it into production. https://venturebeat.com/2019/07/19/why-do-87-of-data- science-projects-never-make-it-into-production.
Xu, Z., Tang, N., Xu, C. and Cheng, X. (2021). Data science: connotation, methods, technologies, and development. Data Science and Management, 1(1), pp.32–37. doi:10.1016/j.dsm.2021.02.002.
Yıldırım, S. (2020). The Dark Side of the Sexiest Job of the 21st Century. [online] Medium. Available at: https://towardsdatascience.com/the-dark-side-of-the-sexiest-job-of-the-21st-century-fd9c46bf4cae.
Artefacts
Meeting Notes
Discussion Board Two
Initial Post
On 25th May 2018, the European Union legislation for data protection (GDPR) became effective and was heralded as a significant milestone for data protection across the union. GDPR has also started a push for global solutions with collaborations across countries such as Brasil, Japan and Australia (Voigt and von dem Bussche, 2017.). The legislation is a complex set of regulations that strengthens individuals' right to manage personal data. It sets a deadline of 72 hours in cases of breaches for companies to notify the relevant authorities and imposes significant fines of up to 4% of turnover (Commission to The European Parliament and of the Council, 2019) in cases of mismanagement, putting the subject to the attention of company executives. Whilst its scope might seem restrictive, the ambition is to "foster trustworthy innovation through harmonising" (Saeed et al., 2017) by removing country-level differences, standardising contracts and cross-border data sharing and storage. Considering the distributed structures of today's companies and the growing amount of data, GDPR brings processes that make companies reevaluate their current approach to data management and set in place best practices to minimise risks of breaches. For example, GDPR compliance rules state that personal data must be accurate, which means that best practice solutions for Master Data Management (MDM) must go hand in hand with GDPR compliance (Cushman, 2018).
Furthermore, consent capture and the right to be informed or forgotten, as set out by GDPR, can hardly be enforced if MDM has duplicates or is outdated. Nonetheless, GDPR has its critics. Zarsky (2017) argued that when GDPR legislation was being developed, it was set to collide with big-data analytics (BGA), as some of the current capabilities were not even available during the legislative period. He further argued that the concept of original purpose mentioned in GDPR contrasts with BGA, as it uses methods and usage patterns that might be totally out of scope from the initial requirement at the collection and would therefore be a GDPR infringement.
References:
Commission to the European Parliament and of the Council (2019). Communication: Data Protection Rules as a Trust-Enabler in the Eu and Beyond – Taking Stock (Com/2019/374). Available At: Shorturl.at/mykms [Accessed 22 Oct. 2022].
Cushman, J. (2018) ‘Why Master Data Management is the Foundation for GDPR Compliance.’ May. [Online] [Accessed on 24th October 2022] https://www.veeva.com/blog/why-master-data-management-is-the-foundation-for-gdpr-compliance/.
Saeed, A., Farkhondeh, H. and Farhad, F. (2017). Learning from Enforcement Cases to Manage GDPR Risks. MIS Quarterly Executive, Vol. 20(3) pp. p199-218.
Voigt, P. and von dem Bussche A (2017). The EU General Data Protection Regulation (GDPR) A Practical Guide. 1st ed. 2017. Cham: Springer International Publishing, 2017. Web.
Zarsky, T. Z. (2017) Incompatible: The GDPR in the Age of Big Data. Seton Hall law review 47.4 : 995–. Print.
Peer response one
Whilst agreeing partly with the research mentioned by Varmaz (2020) and outlined in your post, GDPR nonetheless increases costs for companies and fails to reach the regulator's ambition in fostering trustworthy innovation through harmonisation (Saeed et al., 2017). In addition, in a recent paper, Greene et al. (2019) mentioned how data scientist access to data has been limited due to companies being afraid to fall foul of GDPR. Lefrere et al., 2020 in an additional analysis, also gathered information on how GDPR has negatively impacted traffic on EU websites compared to the USA, potentially impacting revenue across the block.
Further research by Sørum and Presthus (2020) showed a variation in the level of feedback, response time, and quality of how businesses handle individual GDPR requests, which would be somewhat in contradiction with the aim of harmonisation, which was one of the ambitions of GDPR.
Undoubtedly, GDPR has positively impacted consumer data protection; nonetheless, the negative aspects that hinder growth or even negatively impact revenue for some businesses cannot be discounted. Chenet all. (2022) estimated the negative impact of GDPR on EU companies in the range of an 8% profit reduction and a 2% decrease in sales. Considering all the economic implications of GDPR, it is the author's view that whilst regulation of personal data is required, it should not affect businesses to the tune of an 8% profit reduction. In addition, GDPR's "one size fits all approach"needs further improvement, as Layton and Mclendon (2018) have suggested in a recent paper, to reducethe negative impact observed so far on the economy.
References
Chen, C., Benedikt, Ca. and Presidente, G. (2022). Privacy Regulation and Firm Performance: Estimating the GDPR Effect Globally. The Oxford Martin Working Paper Series on Technological and Economic Change. [online] Available at: https://www.oxfordmartin.ox.ac.uk/downloads/Privacy-Regulation-and-Firm-Performance-Giorgio-WP-Upload-2022-1.pdf [Accessed 4 Nov. 2022].
Greene, T., Shmueli, G., Ray, S. and Fell, J. (2019). Adjusting to the GDPR: The Impact on Data Scientists and Behavioral Researchers. Big Data. [online] doi:10.1089/big.2018.0176.
Lefrere, V., Warberg, C., Marotta, V. and Aqusti, A. (2020). The Impact of the GDPR on Content Providers. The 2020 Workshop on the Economics of Information Security.
Layton, R. and Mclendon, J., 2018. The GDPR: What It Really Does and How the US Can Chart a Better Course. FEDERALIST SOC’Y REV., 19, pp.234-236.
Saeed, A., Farkhondeh, H. and Farhad, F. (2017). Learning from Enforcement Cases to Manage GDPR Risks. MIS Quarterly Executive, Vol. 20(3) pp. p199-218.
Sørum, H. and Presthus, W. (2020). Dude, where’s my data? The GDPR in practice, from a consumer’s point of view. Information Technology & People, ahead-of-print(ahead-of-print). doi:10.1108/itp-08-2019-0433.
Varmaz, N. (2020). GDPR vs. Big Data & AI in FinTechs. In: Vierteljahrshefte zur Wirtschaftsforschung, Vol. 89. Available From: https://elibrary.duncker-humblot.com/article/60776/gdpr-vs-big-data-ai-in-fintechs
Peer response two
Lisiak-Felicka et al. (2021) findings are also reflected in a recent study by Bartolini et al. (2019) outlining how training can improve GDPR compliance.
Notwithstanding, Sinur et al. (2019), in a recent study, interviewed companies of different sizes, and it showed that whilst large enterprises were able to process compliance through training, SMBs struggled due lack of resources. Furthermore, SBMs could only adapt GDPR across some of the external contact points in their data network, leaving them at fault for the required compliance. Layton and Mclendon (2018) see the central issue in the GDPR’s “one size fits all” approach, which penalises SMBs the most.
Data protection is paramount today, but regulation should not be detrimental to SMBs’, due to their inability to muster enough resources. The reason for this approach can be found in what Schildberger (2016) defined as a concerted effort by large lobbies to shape GDPR during its inception and SMBs being underrepresented during the lobbying efforts.
Kutyłowski et al. (2020) further analysed the gap between the legal requirements of GDPR and what the technical state-of-the-art could effectively deliver. Even in this instance, it is reasonable to think that large enterprises have more financial power to make such significant investments in state of the art GDPR technologies. Whilst smaller enterprises are unable to muster similar resources for technological solutions.
References:
Bartolini, C., Calabró, A., & Marchetti, E. (2019, January). GDPR and business processes: An effective solution. In Proceedings of the 2nd International Conference on Applications of Intelligent Systems (pp. 1-5).
Kutyłowski, M., Lauks-Dutka, A., & Yung, M. (2020, September). Gdpr–challenges for reconciling legal rules with technical reality. In European Symposium on Research in Computer Security (pp. 736-755). Springer, Cham.
Layton, R. and Mclendon, J., 2018. The GDPR: What It Really Does and How the US Can Chart a Better Course. FEDERALIST SOC’Y REV., 19, pp.234-236.
Lisiak-Felicka, D. and Szmit, M. (2021) “GDPR implementation in public administration in Poland – 1.5 year after: An empirical analysis,” Journal of Economics and Management, 43, pp. 1–21. Available at: https://doi.org/10.22367/jem.2021.43.01.
Schildberger, L. (2016). Lobbying and its influence on the draft of a General Data Protection Regulation of the European Union unveiled in 2012 (Doctoral dissertation, Wien).
Sirur, S., Nurse, J. R., & Webb, H. (2018, January). Are we there yet? Understanding the challenges faced in complying with the General Data Protection Regulation (GDPR). In Proceedings of the 2nd International Workshop on Multimedia Privacy and Security (pp. 88-95).
Summary Post
During the recent interaction with colleagues, it is evident that GDPR legislation has positively affected the privacy rights of citizens in the EU and further afield (Hintze and El Emam, 2018). It is important to note that events such as the Cambridge Analytica affair have been a significant example of the need for stringent regulations (Datoo, 2018). Notwithstanding, a critical view needs to be taken of the adverse side effects that the legislation has caused, which can be divided into two distinct sections. First, a one-fits-all approach has given SMBs similar burdens to large enterprises for being GDPR-ready. It is evident that the legislator did fully evaluate that most SMBs lack the technological bandwidth or legal expertise to put meaningful processes in place, as noted by several authors (McAllister, 2017; Schildberger, 2016; Sinur et al., 2019). Second, the legislator has yet to look forward to the advent of new technologies and the limitations that GDPR either puts or will incur in their evolution.
As rightly noted by colleagues, artificial intelligence and blockchain are typical examples of where GDPR might reach its limits, a point further discussed in a recent paper by Humbeeck (2019). In addition, data science might also conflict with GDPR due to the use of data sets that might lack approval from the original user (Layton and Mclendon (2018). In addition, the risk seen by a corporation in passing on data which puts them at fault with GDPR might further limit the scope of the data scientist. The effects of GDPR on corporations in the EU have been quantified in the range of 8% of sales and 2% of profits (Chen et al., 2022) and an increased complexity burden given to smaller companies that might not be able to be 100% GDPR compliant. A further study by Janßen et al. (2022) further documented the disappearance of more than a third of innovative applications due to the advent of GDPR, which further documents the negative impact of GDPR on growth in some sectors.
These documented challenges addressed by several authors mentioned in this post lay some of the fundaments that need revisiting by the legislator. The final result should be privacy regulations that, on one side, protect the individual from the illicit use of their private data, whilst ensuring that innovative technologies are supported in their growth and not penalising smaller businesses further in an already difficult market situation.
References:
Chen, C., Frey, C.B., and Presidente, G. (2022). Privacy Regulation and Firm Performance: Estimating the GDPR Effect Globally. The Oxford Martin Working Paper Series on Technological and Economic Change, [online] pp.1–42. Available at: https://www.oxfordmartin.ox.ac.uk/publications/privacy-regulation-and-firm-performance-estimating-the-gdpr-effect-globally/ [Accessed 6 Nov. 2022].
Datoo, A., 2018 "Data in the post-GDPR world." Computer Fraud & Security 2018.9 (2018): 17-18.
Hintze, M., & El Emam, K. (2018). Comparing the benefits of pseudonymisation and anonymisation under the GDPR. Journal of Data Protection & Privacy, 2(2), 145-158.
Humbeeck, A. V. (2019). The blockchain-GDPR paradox. Journal of Data Protection & Privacy.
Janßen, R., Kesler, R., Kummer, M. and Waldfogel, J. (2022). GDPR and the Lost Generation of Innovative Apps. SSRN Electronic Journal. doi:10.2139/ssrn.4104014.
Layton, R. and Mclendon, J., 2018. The GDPR: What It Really Does and How the US Can Chart a Better Course. FEDERALIST SOC’Y REV., 19, pp.234-236.
McAllister, C., 2017. What about small businesses: the GDPR and its consequences for small, US-based companies. Brook. J. Corp. Fin. & Com. L., 12, p.187.
Schildberger, L. (2016). Lobbying and its influence on the draft of a General Data Protection Regulation of the European Union unveiled in 2012 (Doctoral dissertation, Wien).
Sirur, S., Nurse, J. R., & Webb, H., 2018. Are we there yet? Understanding the challenges faced in complying with the General Data Protection Regulation (GDPR). In Proceedings of the 2nd International Workshop on Multimedia Privacy and Security (pp. 88-95).
Data Analysis Report And Final Essay
Giuseppe Raneli
Student Number: 12691423
Word count: 1459
Data Analytics Report
Purpose
This paper aims to create a Data Analytics Report (DAR), which will provide a modus operandi for analysing and evaluating the National Survey for Wales, 2013-14 – Transport survey (NSWT). To support the analysis further, a recent strategy paper (Welsh Government, 2021) that addressed the goals of the Transport Wales department will be used to develop some KPIs for measurement. The goals set in the Welsh strategy paper address three distinct areas. First, bringing service to people by aiming for 30% of the workforce to work from home by creating new travel routes and moving oversized haul freight onto smaller vehicles. The second goal is centred around facilitating the movement of people and goods, focusing on effectiveness and efficiency. Here the strategy is centred on reliability, safety, reach, understandable fares, ease of use, congestion reduction and improved working infrastructure. Third, achieve sustainability through shared services, reduced public transport costs, increased alternative transport and encouraging people to use public transport. These strategies would also align with the overarching goals of the UK transport department around improvement, sustainability and innovation (GOV.UK, 2021).
As rightly noted by colleagues, artificial intelligence and blockchain are typical examples of where GDPR might reach its limits, a point further discussed in a recent paper by Humbeeck (2019). In addition, data science might also conflict with GDPR due to the use of data sets that might lack approval from the original user (Layton and Mclendon (2018). In addition, the risk seen by a corporation in passing on data which puts them at fault with GDPR might further limit the scope of the data scientist. The effects of GDPR on corporations in the EU have been quantified in the range of 8% of sales and 2% of profits (Chen et al., 2022) and an increased complexity burden given to smaller companies that might not be able to be 100% GDPR compliant. A further study by Janßen et al. (2022) further documented the disappearance of more than a third of innovative applications due to the advent of GDPR, which further documents the negative impact of GDPR on growth in some sectors.
In 2021 transport of Wales published a more recent survey, and the aim will be to benchmark the 2021 results against the 2013/14 results to see if the previous aims have been achieved and where still more work needs to be delivered.
Design Approach
As the NSWT is quantitative, the design methodology used for evaluation should have two defined characteristics. First, the ability to be replicated by others and the possibility to measure improvements or deteriorations. Bowerman et al. (2002) suggested that government initiatives should encourage benchmarking in most spheres of public activity. Considering the ongoing use of benchmarking in UK public initiatives (Hinton et al., 2000), the author suggested a similar approach for the DAR.
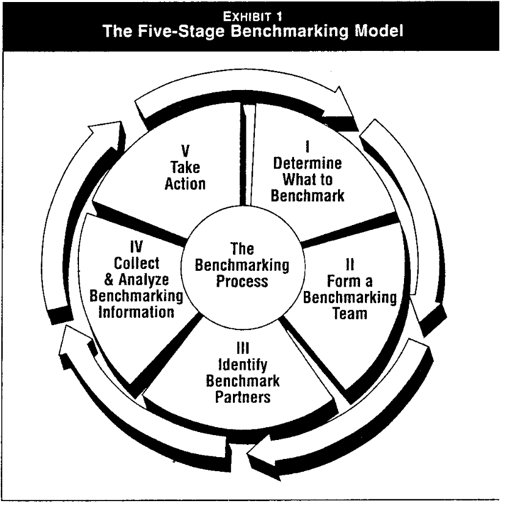
Benchmarking is a well-known tool used by different governments to measure the performance of infrastructure or do comparative analyses (Henning et al., 2011), which would be the aim of the DAR. The benchmarking process will follow Spendolini’s (1992) five-step approach, as seen in exhibit 1:
Exhibit 1

(Spendolini, 1992)
In this instance, we will focus on steps one, four and five by first defining the KPIs, collecting and analysing the data and providing a report on critical areas of concern.
As mentioned previously, the KPI's selection has been linked to the goal set by the Welsh government in their 2021 paper. Whilst the selection is not exhaustive, it does address some of the core ambitions outlined in the paper and is provided in Table 1.
Table 1:
| KPI’s | Definition | Goal |
|---|---|---|
| Satisfaction | An indicator of how public transport is perceived | Satisfaction is a determining factor in public transport usage, and monitoring overall perception might promote increased usage. |
| Travel modus operandi | Tracking usage of personal cars to drive to work | The objective is to monitor progress to see if there has been an uptake in public transport use to go to work. |
| Safety | This point addresses personal security and how safe citizen feel whilst using public transport. | This point might be a limiting factor in usage, and an improvement might increase usage. |
| Sustainability | An indicator of how many citizens own a car and their travel mod | Monitor areas in which public transport needs to increase and drive more public transport usage to reduce emission/td> |
One of the significant challenges in establishing the benchmarking process is selecting the correct data as defined in stage four of Spendolini’s model.
Understandably, using a public opinion survey system is integral for governments to implement decisions (Ji, 2011), as the NSWT suggests. The NSWT survey is divided into 42 different tables and can be divided into four distinct classes as defined in Exhibit 2:
Exhibit 2:
Stand-alone survey data can easily lead to confusion if the overall structure is ignored and the inherent goals or KPIs are not clearly defined and understood (Guo, Wang and Fan, 2009).
This situation has led to the development of more sophisticated models to understand the relationships between data (Ji, 2011) in survey management. Ji further evolves the model by introducing the concept of the system into survey management to evaluate and understand the complexity of interactions between the survey using UML as an analysis tool. In this instance, a similar process will be applied for the data modelling of this study.
In the present case, the connections between the tables, the KPIs and the actors involved will be represented with a UML use case diagram by mapping the structure of the systems using actors and use cases as suggested by Gemino and Parker (2009). UML use case diagrams often describe a set of activities and services the system needs to perform whilst actors work in defined roles within the described system.
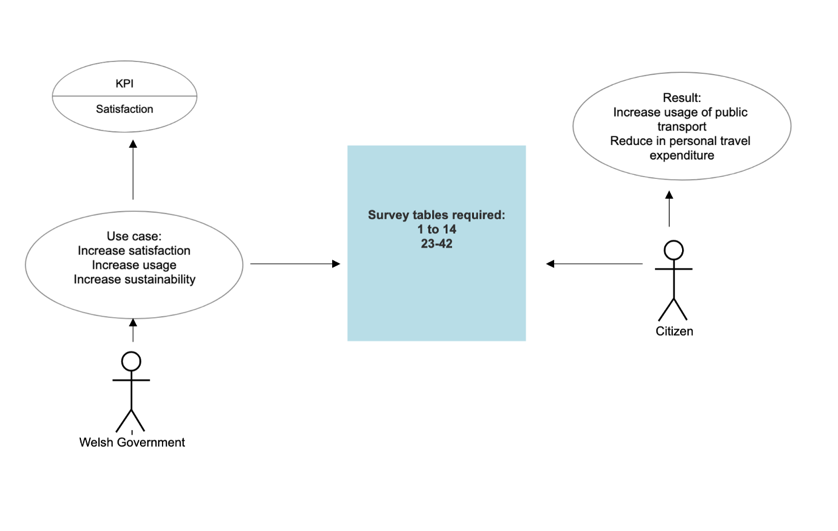
Exhibit 3, in this instance, describes the system to deliver on the KPI called satisfaction, the survey tables required to address the aims, the Welsh government, and the citizen representing the actors involved.
Exhibit 3:
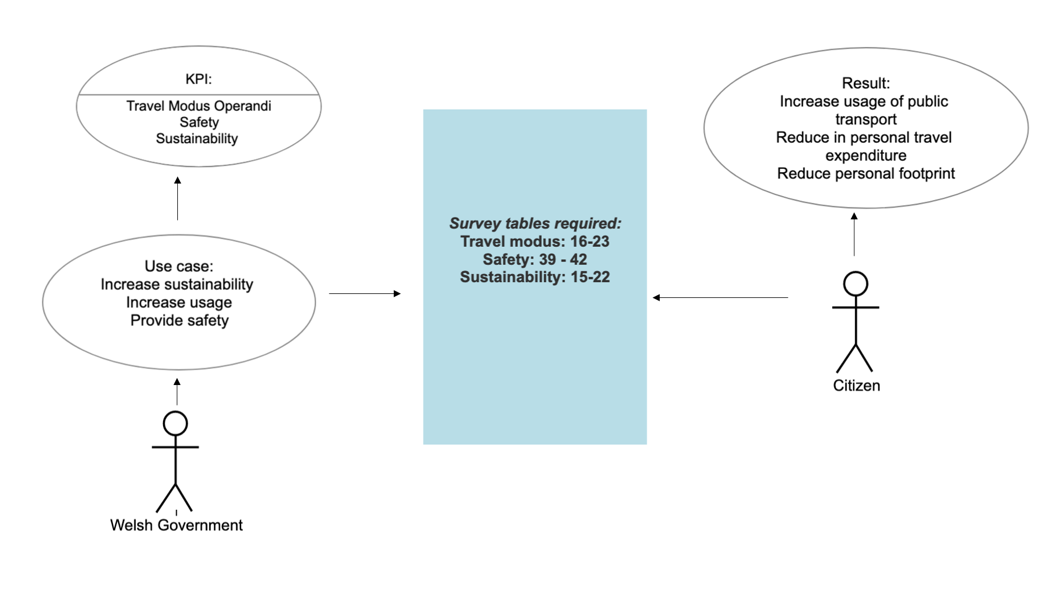
Similarly, Exhibit 4 describes the systems linked to travel modus operandi, safety and sustainability whilst identifying the purpose of the survey, KPIs and actors involved:
Exhibit 4:
The expected results linked to the citizen as final actors have been derived from a study by Beirão and Cabral (2007). In the study, the authors suggest that an increase in public transportation usage can be achieved by addressing the level of service required by customers.
Key findings indicate that to increase public transport usage by the public; the service should be designed to accommodate the levels of service required by customers and, by doing so, attract potential users.
In addition, satisfaction towards public transport has a strong influence on transport modus operandi. Nonetheless, it has been noted that most users will maintain the same level of private car ownership but that an increase in public transport users can be expected (Jensen, 1999) if attractiveness increases. This attitude towards transport needs significant focus as it is the most crucial determinant for mode choice, as further analised by Beirão and Cabral (2007). This increased intention to switch by improving the attraction of public transport has been used as the final aim for the citizen being the final stakeholder, as shown in the above UML diagrams.
Whilst our aim should be to address all survey data available, the complexity would be outside the scope of this study, and we will focus on five tables per class to address the above KPIs.
Results
The author will present the results through histogram graphs in which 2013/14 data is compared to 2021 data alongside a critical analysis to asses improvements or deteriorations. Whilst the NSWT is limited in terms of data points, and Microsoft Excel as a tool would suffice for the analysis, Python will be preferred due to the ability to use packages such as Matplotlib, Pandas and Seaborn for more detailed visualisation and data interpretation as suggested by the Corporate Finance Institute (2022)
Summary
Using benchmarking in transport evaluations is quite common, as recent studies suggest by McKinnon (2009) and Henning et al. (2011). In this instance, we will use Spendolini’s (1992) approach, focusing on steps one, four and five of the process. The KPIs to measure the benchmark have been taken from the recent discussion paper from the Welsh Government (2021) and identified as Satisfaction, Travel Modus Operandi, Safety and Sustainability. As JI (2021) suggested, a UML representation has been used to identify KPIs, actors, connections and interactions within the survey system. The final result will be a critical analysis of the results in line with histograms for graphical visualisations that will outline possible improvements and deterioration using Python as a data analysis tool.
Research limitations/implications
Despite the benefits of benchmarking, results are often only effective if goals are well-defined (McGuire, 2021). This lack of definition might be an issue in this paper due to its comparative nature and the impossibility of suggesting improvements. In addition, this paper will lack follow-up studies to see if ongoing progression is being achieved and which should be an integral part of the benchmarking process (McKinnon, 2009). Last but not least, the study focused on four KPIs and might be reductive considering the number of data points available, limiting the scope of the benchmarking process and not focussing on other significant inter-relationships that could have provided a more complex analysis. In addition, the NSWT has provided data that might have included errors, such as not representing the whole population or having misinterpretations linked to the survey collection and delivery method. It must be noted that the survey consisted of 42 different tables. It would need a minimum of 5 respondents’ pro questions to provide essential data, which could not be verified in this instance (Memon et al. (2020).
References:
Beirão, G. and Sarsfield Cabral, J.A. (2007). Understanding attitudes towards public transport and private car: A qualitative study. Transport Policy, [online] 14(6), pp.478–489. doi:10.1016/j.tranpol.2007.04.009.
Bowerman, M., Francis, G., Ball, A. and Fry, J. (2002). The evolution of benchmarking in UK local authorities. Benchmarking: An International Journal, 9(5), pp.429–449. doi:10.1108/14635770210451455.
Corporate Finance Institiute (2022). Transitioning from Excel to Python. [online] Corporate Finance Institute. Available at: https://corporatefinanceinstitute.com/resources/data-science/transitioning-from-excel-to-python/ [Accessed 14 Nov. 2022].
Gemino, A. and Parker, D. (2009). Use Case Diagrams in Support of Use Case Modeling. Journal of Database Management, [online] 20(1), pp.1–24. doi:10.4018/jdm.2009010101.
GOV.UK (2021). Future of Transport programme. [online] GOV.UK. Available at: https://www.gov.uk/government/collections/future-of-transport-programme [Accessed 12 Nov. 2022].
Guo, N., Wang, D. and Fan, Y. (2009). Analysis and Design of Digital Drawing Management Information System based on UML. Mechanical Science and Technology for Aerospace Engineering;, 28(3), pp.404–11.
Henning, T.F.P., Muruvan, S., Feng, W.A. and Dunn, R.C. (2011). The development of a benchmarking tool for monitoring progress towards sustainable transportation in New Zealand. Transport Policy, [online] 18(2), pp.480–488. doi:10.1016/j.tranpol.2010.10.012.
Hinton, M., Francis, G. and Holloway, J. (2000). Best practice benchmarking in the UK. Benchmarking: An International Journal, 7(1), pp.52–61. doi:10.1108/14635770010314954.
Jensen, M. (1999). Passion and heart in transport—a sociological analysis on transport behaviour. Transport Polic, 6(1), p.pp. 19-33.
Ji, X. (2011). Analysis and Design for Object-oriented Multi-tier Architecture of Public Opinion Survey System Based on UML. Procedia Engineering, 15, pp.5445–5449. doi:10.1016/j.proeng.2011.08.1010.
McGuire, D. (2021). Council Post: Benchmarking: The Good And The Bad. [online] Forbes. Available at: https://www.forbes.com/sites/forbesfinancecouncil/2021/04/12/benchmarking-the-good-and-the-bad/?sh=6c9211cf5596 [Accessed 12 Nov. 2022].
McKinnon, A.C. (2009). Benchmarking road freight transport. Benchmarking: An International Journal, 16(5), pp.640–656. doi:10.1108/14635770910987850.
Memon, M.A., Ting, H., Cheah, J.-H., Thurasamy, R., Chuah, F. and Cham, T.H. (2020). Sample Size for Survey Research: Review and Recommendations. Journal of Applied Structural Equation Modeling, [online] 4(2), pp.i–xx. doi:10.47263/jasem.4(2)01.
Spendolini, M.J. (1992). The Benchmarking Process. Compensation & Benefits Review, 24(5). doi:https://doi-org.uniessexlib.idm.oclc.org/10.1177/088636879202400505.
Welsh Government (2021). Llwybr Newydd: the Wales transport strategy 2021 Our strategy to shape the future of transport in Wales. Transport planning and strategy. [online] Available at: https://gov.wales/llwybr-newydd-wales-transport-strategy-2021 [Accessed 12 Nov. 2022].
Giuseppe Raneli
Student Number: 12691423
Word count: 2122
Data Analytics Implementation
Introduction
This paper aims to create a data analysis and critical evaluation of the Wales, 2013-14 – Transport survey (NSWT). In addition, data provided by a recent strategy paper (Welsh Government, 2021) that addressed the goals of the Transport Wales department (TW) and updated surveys for 2019 and 2021 were used to support the analysis further. The objectives addressed by the 2021 strategy paper cover three distinct areas. First, bringing service to people by aiming for 30% of the workforce to work from home, create new travel routes, and move oversized haul freight onto smaller vehicles. Second, it seeks to facilitate the movement of people and goods by focusing on effectiveness and efficiency. Here the strategy is centred on reliability, safety, reach, understandable fares, easiness of use, congestion reduction and improved working infrastructure. Third, achieve sustainability through shared services, reducing public transport costs, increasing alternative transport and encouraging people to use public transport (Raneli, 2022). It is noteworthy that the strategies mentioned above also align with the overarching goals of the UK transport department around improvement, sustainability and innovation (GOV.UK, 2021). TW has delivered two further surveys in 2019 and 2021 (Welsh Government, 2022), which restated similar aims. These updated results have been part of the benchmark process and compared to the 2013/14 results and help in critically highlighting divergences and proposing a possible course of action.
Data Pre-Processing And Methodology
In the recent data analytics report (Raneli, 2022), the author proposed a benchmark for comparing the 2013/14 and 2021 results. The original scope has been further enlarged by adding a table around satisfaction from the 2019 survey. As a methodology, Spendolini's (1992) five-step benchmarking approach was used, as seen in exhibit 1:
Exhibit 1
Spendolini's process has been chosen due to its traditional use in government projects (Hinton et al., 2000) and monitoring progress in mass transport initiatives (Guo, Wang and Fan, 2009). Furthermore, benchmarking has a long tradition for analysing improvements or deteriorations in UK local authorities (Bowerman et al., 2002), a core aim for this paper. In this instance, we will focus on steps I, IV, and V of Spendolini’s benchmarking process, as outlined below.
Step I: Identifying what to benchmark.
TW identified in its 2021 paper four core KPIs to improve its mass transport system. As a first KPI, satisfaction is interpreted as a core indicator of how the public perceives the mass transport system. This indicator would support Jensen's (1999) thesis that despite the public not abandoning car usage, overall satisfaction with public transport tends to be a leading indicator of increased usage. Tables 1 to 14 and 23 to 38 of the NSWT tend to address this KPI by measuring satisfaction with the service and easiness of reaching healthcare institutions. Second Travel modus operandi to understand car usage and ownership. This KPI aims to reduce usage through increased public transport usage and would further aid in increased sustainability. Tables 15 to 22 of the NSWT address this by gauging car usage and ownership. Third perception of safety on public transport. Several authors (Ait Bihi Ouali et al., 2019; Currie et al., 2013; Delbosc & Currie, 2012) have indicated how perceived unsafety is a leading cause of reduced public transport usage. The perception of safety as a KPI is addressed in tables 39 to 42 by inquiring perceived sense of safety across different indicators. Sustainability has been identified as the fourth KPI as it is linked to an increase in public transport usage with the ultimate aim of reducing personal car use in line with countrywide and Welsh initiatives. Tables 15 to 22 as mentioned before, outline ownership and usage, which address the KPI.
Due to a large amount of data available, this paper has a narrower focus on two core areas: First, a quantitative evaluation of sustainability and safety as key indicators. Second, a qualitative analysis to critically evaluate the leading causes of dissatisfaction with the mass transport system. The aim has been achieved by comparing tables from the 2019 and 2021 surveys versus the 2013 survey. This approach is dictated by the fact that the 2013 and 2021 surveys differ in their questions and scope, making a quantitative like-for-like comparison difficult or prone to misinterpretations. A satisfaction table around bus and train usage from 2019 has been chosen to aid this process.
Step IV: Collect and analyse benchmarking information
2013, 2019, and 2021 TW surveys provided the data for this paper. Hence the main focus of Step IV has been on the process used for data preparation and critical analysis. Unfortunately, TW provided the data in different formats. Therefore, a manual import into a python environment in CSV formats for data preparation and modelling has been required to make the data accessible.
Dietrich et al. (2015) define data preparation as the process in which we explore and condition data prior to modelling and analysis. The authors further state the importance of familiarising with the data and transforming it to be useful for modelling. Brownlee (2020) further suggests that the preparation process should include additions, deletions or transformations. This study's primary preparation process will focus on deletions and transformations. As the 2013/14 data has a different format from the 2021 data, quartile data has been deleted whilst focusing on the total values to make the data comparable. This outcome was achieved using Python's drop functions to reduce both data to similar formats. Furthermore, as the data is presented with different indexes, a rename and transpose function was applied to generate similarity. Brownlee (2020) further suggests transforming data to scale or distribute data as required. This process is not required in this context due to the similarity of the tables used. The final step is to join the separate tables with a concat function and use the transformed data for visualisation.
In order to highlight differences between 2013/14 and 2021 data, bar chart visualisations. Taher et al. (2017) advocate the usage of bar charts as an effective tool for "preparing views to communicate insights about data, whilst Kolodziej et al. (2016) propose bar charts for setting priorities in visualisation. In this instance, bar charting has been chosen due to the possibility of priority setting, highlighting differences between years and their communicative power. Seaborn and Matplotlib have been used to create visualisations due to the possibility of making statistical graphics in Python and automating most of the process (Waskom, 2021).
Data Analysis and evaluation (Step V)
Exhibit 2:
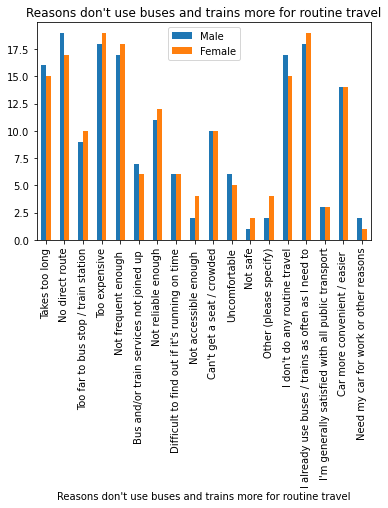
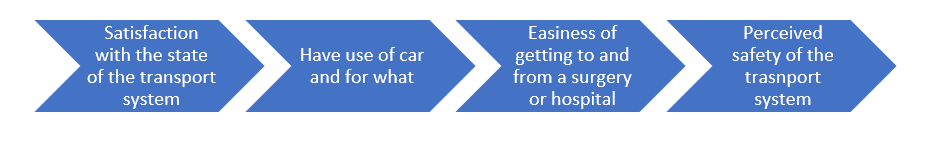
TW created a new survey in 2021, which in contrast to 2013/14, inquired about why public transport is not routinely used. Lack of direct routes, overall cost, frequency and the convenience of cars have been cited as the main reason for limited usage, as seen in exhibit 2 and comparable with similar observations from other authors (Beirão & Sarsfield Cabral, 2007; Şimşekoğlu et al., 2015). The 2013/14 survey nonetheless inquired about overall satisfaction with the transport system, as seen in exhibit 3, which showed a positive median of 6. Nonetheless, a critical evaluation of the 2021 survey item "I am generally satisfied with all public transport" showed a sharp dissatisfaction, indicating a deterioration in overall perception since 2013/14.
Exhibit 3:

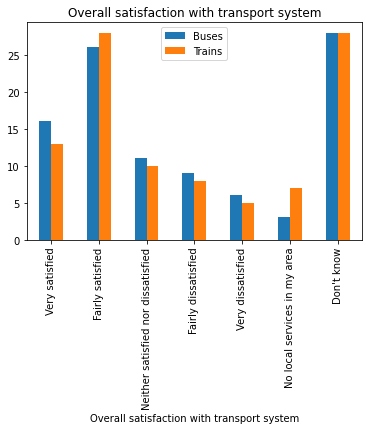
A further survey done by transport of Wales in 2019, shown in exhibit 3a, highlights that 42% of surveyed people are either "Very" or "Fairly satisfied" with buses and trains. Notwithstanding, a significant amount of the surveyed did not express an opinion, and most dissatisfaction was centred around buses.
Exhibit 3a:
This result would further confirm a similar perception across the whole of the United Kingdom, as observed by a recent study by Monsuur et al. (2021)
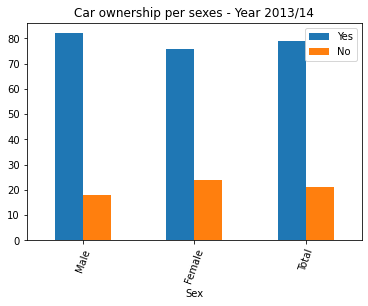
A recent study by Cullinane (2002) showed that affordability and increased satisfaction with public transport decreases overall car ownership. Contrary, a moderate increase can be noted if we compare car ownership between 2013/14 and 2021 in Exhibit 4.
Exhibit 4:
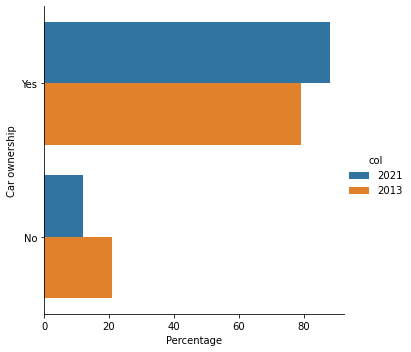
This result would support the previous analysis that satisfaction has decreased and is a possible cause for increased car ownership. Furthermore, this result also negatively affects most KPIs such as sustainability, increased service and public transport use. Redman et al. (2013) noted that a trend reversal is possible if accessibility and quality are targeted, which were negatively evaluated in the 2021 survey.
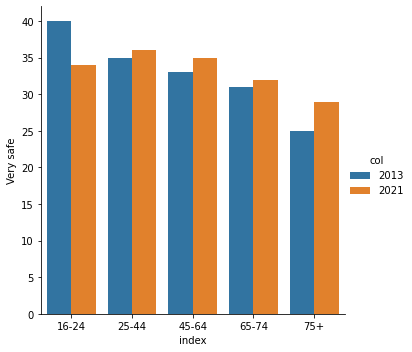
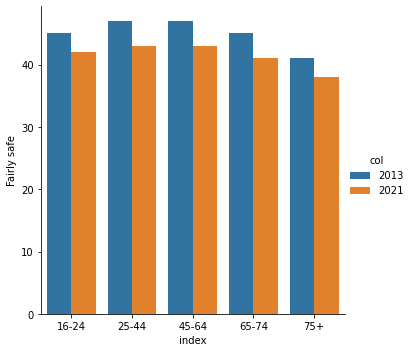
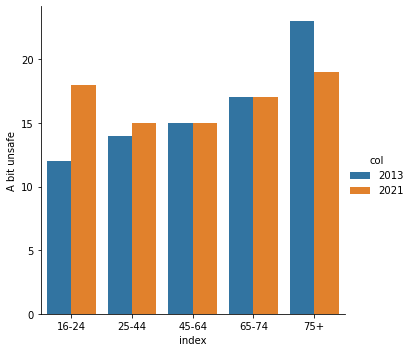
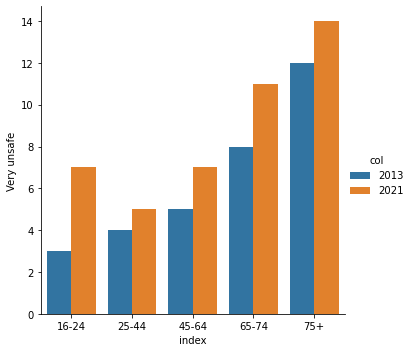
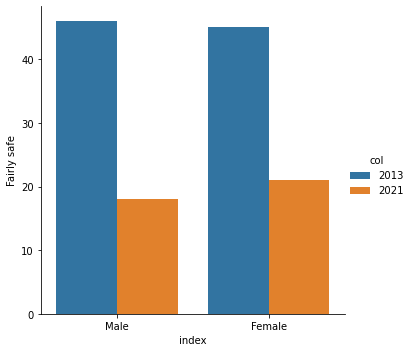
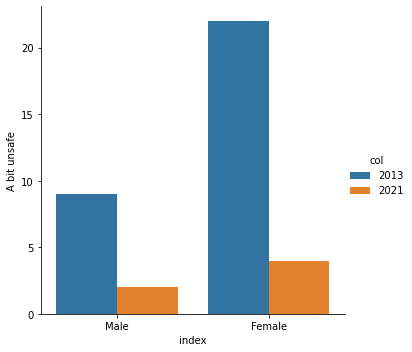
Esad Ergin (2022) further highlighted the perception of a lack of safety as a critical indicator of reduced public transport usage. A comparative analysis between 2013/2014 and 2021 perception of safety data, as shown in exhibits 5 and 6, reveals a changing attitude and deterioration in some categories, which would provide an additional reason for dissatisfaction with the Wales transport system and an increased drive towards car ownership. This link between increased car ownership and safety is also highlighted in research from Delbosc and Currie (2012).
Exhibit 5 shows the comparison of safety perception across ages. Interestingly, most categories that had a perception of "Very safe" or "Very unsafe" in 2013 have further strengthened their position, which could be interpreted as an effect of polarisation. Nonetheless, a deeper analysis of the “Fairly safe” and Fairly unsafe” categories provide a slightly deteriorating picture, with only people above 75 years feeling less unsafe. Despite overall deterioration, most surveyed perceive the mass transport system as either "Very" or "Fairly safe".
Exhibit 5:
Further analysis of the perception of safety across gender shows a similar picture. Most surveyed have a feeling of either very or fairly safe of the transport system, despite an overall deterioration observed since the 2013/14 survey, with females bearing most of the opposing view as seen in Exhibit 6.
Exhibit 6:
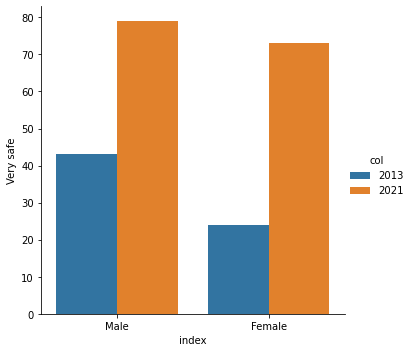

Despite the above results, the 2013 survey around car ownership per gender observes that most owners were male. Unfortunately, the 2021 survey did not further analyse car ownership per gender, which would help to gauge if the perceived sense of deteriorating safety impacted increased female car ownership, which is a limitation of this study.
Solutions
Whilst the ambitions of TW are to bring increased service to people, improve sustainability and achieve an increase in mass transport usage, from the results, we can observe a different picture of decreased satisfaction, a slight deterioration in perceived safety and an ulterior increase in car ownership since 2013. In addition, the 2021 satisfaction survey showed the ease of car usage, lack of transport routes and cost as contributing factors to reduced usage. In view of the multitude of negative factors, proposing a unique solution would be complex.
Considering that the UK is one of the safest places in the world (Macrotrends, 2022), Shiwakoti et al. (2019) proposed a solution for the Australian Transport Authority, which could serve as a blueprint. The author proposed that authorities increase safety awareness through constant communication, as perceived safety on transport systems aids towards increased usage. In addition, the same author proposes extending connections to augment existing routes to bring service to areas not covered, increasing usage further. An increase in routes and safety would ultimately improve the perception of quality and further reduce car ownership and public transport usage, as argued by Cullinane (2002). Increasing overall usage would provide further funds to decrease usage costs, increase productivity, and help TW reach their 2021 goals. A similar solution has been implemented in Germany with visible success and increased sustainability and could serve as a blueprint for TW (Buehler & Pucher, 2011).
Limitations
Several limitations do affect the study. First, most of the data have some structural differences across the years, and TW has also changed some of the survey questions, making a like-for-like comparison difficult and incomplete across most data available, which is due to several survey questions being omitted altogether over the years. Overall satisfaction with the mass transport system is one of the most salient absences. Furthermore, both sets, 2013/14 and 2021, have shown data collection imperfections, such as totals not adding up or being over or under 100%. Last but not least, the modality of result quantification has changed over the years, moving from medians to percentages. This change complicates a like-for-like quantitative comparison for specific tables as comprehensive survey data is unavailable, making only a qualitative interpretation possible.
References:
Ait Bihi Ouali, L., Graham, D. J., Barron, A. and Trompet, M. (2019) ‘Gender Differences in the Perception of Safety in Public Transport.’ SSRN Electronic Journal.
Beirão, G. and Sarsfield Cabral, J. A. (2007) ‘Understanding attitudes towards public transport and private car: A qualitative study.’ Transport Policy, 14(6) pp. 478–489.
Bowerman, M., Francis, G., Ball, A. and Fry, J. (2002). The evolution of benchmarking in UK local authorities. Benchmarking: An International Journal, 9(5), pp.429–449. doi:10.1108/14635770210451455.
Brownlee, J. (2020) Data preparation for machine learning: data cleaning, feature selection, and data transforms in Python. Machine Learning Mastery.
Buehler, R. and Pucher, J. (2011) ‘Making public transport financially sustainable.’ Transport Policy, 18(1) pp. 126–138.
Cullinane, S. (2002) ‘The relationship between car ownership and public transport provision: a case study of Hong Kong.’ Transport Policy, 9(1) pp. 29–39.
Currie, G., Delbosc, A. and Mahmoud, S. (2013) ‘Factors Influencing Young Peoples’ Perceptions of Personal Safety on Public Transport.’ Journal of Public Transportation, 16(1) pp. 1–19.
Delbosc, A. and Currie, G. (2012) ‘Modelling the causes and impacts of personal safety perceptions on public transport ridership.’ Transport Policy, 24, November, pp. 302–309.
Dietrich, D., Heller, B. and Yang, B. (2015) Data science & big data analytics : discovering, analyzing, visualizing and presenting data. Indianapolis, In: Wiley.
Esad Ergin, M. (2022) ‘Safety Perception of Users and Willingness to Pay for Safer Public Transport.’ International Journal of Science and Research (IJSR), 11(1) pp. 603–607.
GOV.UK (2021). Future of Transport programme. [online] GOV.UK. Available at: https://www.gov.uk/government/collections/future-of-transport-programme [Accessed 12 Nov. 2022].
Guo, N., Wang, D. and Fan, Y. (2009). Analysis and Design of Digital Drawing Management Information System based on UML. Mechanical Science and Technology for Aerospace Engineering;, 28(3), pp.404–11.
Hinton, M., Francis, G. and Holloway, J. (2000). Best practice benchmarking in the UK. Benchmarking: An International Journal, 7(1), pp.52–61. doi:10.1108/14635770010314954.
Jensen, M. (1999). Passion and heart in transport—a sociological analysis on transport behaviour. Transport Polic, 6(1), p.pp. 19-33.
Kolodziej, R., Hesse, F. W. and Engelmann, T. (2016) ‘Improving negotiations with bar charts: The advantages of priority awareness.’ Computers in Human Behavior, 60, July, pp. 351–360.
Macrotrends (2022) Crime Rate & Statistics by Country. www.macrotrends.net. [Online] [Accessed on 10th December 2022] https://www.macrotrends.net/countries/ranking/crime-rate-statistics.
Monsuur, F., Enoch, M., Quddus, M. and Meek, S. (2021) ‘Modelling the impact of rail delays on passenger satisfaction.’ Transportation Research Part A: Policy and Practice, 152, October, pp. 19–35.
Raneli, G. (2022) Data Analitics Report. Essay.
Redman, L., Friman, M., Gärling, T. and Hartig, T. (2013) ‘Quality attributes of public transport that attract car users: A research review.’ Transport Policy, 25, January, pp. 119–127.
Şimşekoğlu, Ö., Nordfjærn, T. and Rundmo, T. (2015) ‘The role of attitudes, transport priorities, and car use habit for travel mode use and intentions to use public transportation in an urban Norwegian public.’ Transport Policy, 42, August, pp. 113–120.
Spendolini, M.J. (1992). The Benchmarking Process. Compensation & Benefits Review, 24(5). doi:https://doi-org.uniessexlib.idm.oclc.org/10.1177/088636879202400505.
Shiwakoti, N., Stasinopoulos, P., Vincec, P., Qian, W. and Hafsar, R. (2019) ‘Exploring how perceptive differences impact the current public transport usage and support for future public transport extension and usage: A case study of Melbourne’s tramline extension.’ Transport Policy, 84, December, pp. 12–23.
Taher, F., Jansen, Y., Woodruff, J., Hardy, J., Hornbaek, K. and Alexander, J. (2017) ‘Investigating the Use of a Dynamic Physical Bar Chart for Data Exploration and Presentation.’ IEEE Transactions on Visualization and Computer Graphics, 23(1) pp. 451–460.
Waskom, M. (2021) ‘seaborn: statistical data visualization.’ Journal of Open Source Software, 6(60) p. 3021.
Welsh Government (2022) National Survey for Wales: results viewer. GOV.WALES. [Online] [Accessed on 7th December 2022] https://gov.wales/national-survey-wales-results-viewer.
Welsh Government (2021). Llwybr Newydd: the Wales transport strategy 2021 Our strategy to shape the future of transport in Wales. Transport planning and strategy. [online] Available at: https://gov.wales/llwybr-newydd-wales-transport-strategy-2021 [Accessed 12 Nov. 2022].
Reflective Piece
Becoming a data professional has been quite a difficult journey coming from a pure business background, a situation often encountered in similar situations (Ellaway, 2014).
Firstly, creating an e-portfolio from nothing, with no experience in either GitHub or HTML, has been a steep learning curve, and the final result has been a personal achievement. In addition, it helped me to learn HTML. Codio has been of zero use, and most of my exercises have been done in Jupiter notebook or external platforms.
Nonetheless, the learning has been quite significant, as preparing for the discussion boards has shown. Colleague's feedback around issues such as the future of the profession and the evolution that the role has to complete to become fully productive has been quite enlightening. Critically it also poses personal doubts, as overall, the potential of the MSc is minimal for my development as a quant trader.
The discussion forum has also been quite insightful for the view on data management and data protection, where challenges for SMBs have been totally discounted. Sometimes, the benefits are limited in scope despite the best intention to guarantee rights to EU citizens.
Lastly, the work on data analysis on the Welsh Transport system has been an insightful experience and good practice on what we have learned so far. The possibility of comparing data across several years and creating a benchmark using Spendoli's (1992) process has been quite enlightening. In addition, it solidified my understanding of seaborn and data transformation.
References:
Ellaway, R. H., Pusic, M. V., Galbraith, R. M., & Cameron, T. (2014). Developing the role of big data and analytics in health professional education. Medical teacher, 36(3), 216-222.
Spendolini, M. J. (1992). The benchmarking process. Compensation & Benefits Review, 24(5), 21-29.